Mobile Apps for Lean and Six Sigma Help
Check out these Lean and Six Sigma related mobile apps for iOS devices (available on iTunes) and Android (Google Play), many of which are free! Click on the app icon to learn more. Contact us if you know of some good apps that should be listed.
ASQ Six Sigma Green and Black Belt Exam Prep Bundle $7.99  Category: Application | Get twice the value by bundling Upward Mobility’s Six Sigma Green Belt and Black Belt test prep apps for iPhone! OVERVIEW: FEATURES: In many cases, professional training is reimbursable. Check with your employer or tax accountant to determine if this training module would be for you. Upward Mobility is not associated with the ASQ, IASSC or any other professional organization. ABOUT UPWARD MOBILITY: We are a double bottom line company that is committed to education in the developing world. Some of the profits will be used to deploy education via mobile phone in emerging countries to improve their total factor productivity growth. Customer satisfaction is our top priority, and if you have any questions or comments or are unsatisfied with our products in any way, please contact us at info@upwardpro.com and we will do our best to help you. Don’t want both? Get only the ASQ Green Belt Exam Prep or ASQ Black Belt Exam Prep for $7.99 each. |
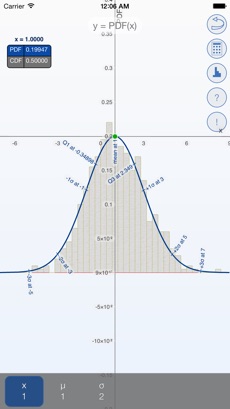
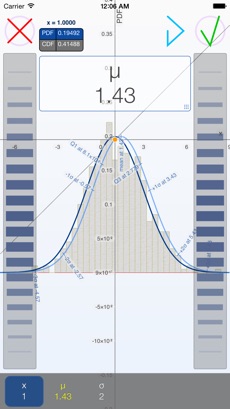
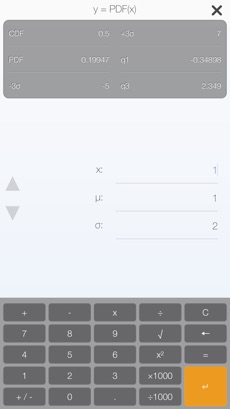
Bell Curves FREE  Category: Analysis | * Build interactive graphs of the probability density function (PDF) the cumulative distribution function (CDF) for normal distributions Bell Curves is an interactive graphing tool and calculator for the bell curve probability density function.
|
Cycle Time – stopwatch FREE  Category: Analysis | Cycle time app is made by engineers for engineers. It combines an high-accuracy industrial stopwatch with real-time statistics. With this app you can measure the mean cycle time of any automated process and see other statistics in real-time (part per hour for example). Tap on the lap button to start measuring and see the stats being recalculated at each lap. If you are using this app for work, we recommend you to subscribe and access all features designed for professionals. By subscribing to full version you could store times in a database for each process. You could then retrieve those times anytime and continue adding new samples. Also, you could export samples into a .CSV file and open it with Excel for further analysis. We are eager to receive your feedback and continuously improve the app. For this reason, we provided the app with a simple button to ask for new features. Just tap on settings->bug/feature request. We listen to all requests and develop the most wanted ones in order to keep offering you the best stopwatch for engineers.
|
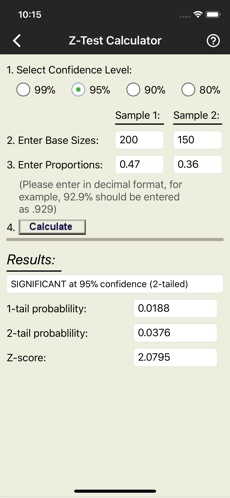
StarStat FREE Category: Analysis | StarStat is a free statistical calculator designed to easily perform tests of statistical significance on your survey data. Survey researchers use significance testing as an aid in expressing the reliability of survey results. Phrases such as “significantly different,” “margin of error,” and “confidence levels” help describe and make comparisons when analyzing data. The purpose of this free tool is to aid researchers in performing appropriate statistical tests for data analysis. StarStat includes 3 different tests: Z-test Calculator: T-test Calculator: Sample Precision Calculator: StarStat was developed by DataStar, Inc., a leading provider of survey management and data processing services, specializing in web surveys for employee and customer feedback. For more information, contact us at www.surveystar.com.
|
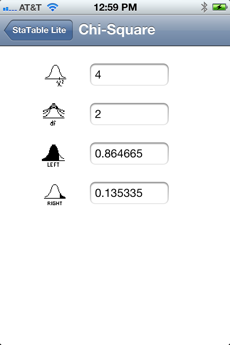
StaTable $2.99 Category: Analysis | StaTable provides immediate access to twenty five most commonly used statistical distributions. With just a few keystrokes, the tail area or percentage point you want appears in a window. StaTable eliminates hunting for books of tables, interpolation, and risk of calculation error. The following statistical distributions are accessible in StaTable. Continuous: 1) Normal, 2) Chi-Square, 3) Student’s t, 4) F-distribution, 5) Lognormal, 6) Bivariate Normal, 7) Exponential, 8) Gamma, 9) Weibull, 10) Uniform, 11) Beta, 12) Triangular, 13) Cauchy, 14) Gumbel, 15) Pareto, 16) Logistic, 17) Non-Central Chi-Square, 18) Non-Central Student’s t, 19) Non-Central F Discrete: 20) Binomial, 21) Multinomial, 22) Poisson, 23) Negative Binomial, 24) Hypergeometric, 25) Geometric Looking up Table Values: If you are looking up probabilities for a given variate value simply type the value(s) into the top-most cell(s). The desired probabilities will be computed and shown in the bottom group of probability cells. If you are looking for the percentile point for a given probability, enter this value in the appropriate probability cell. The top-most cell will then display the required percentile point value. For other inquiries and feedback, please send email to statable-info@cytel.com. Note: StaTable for OS X (Mac) is available on Mac App Store. Lite version also available >>>
|
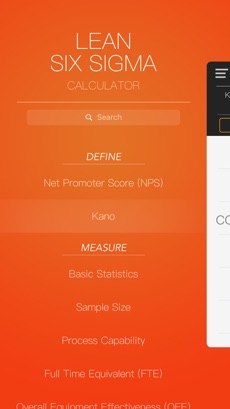
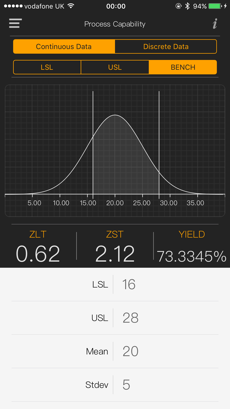
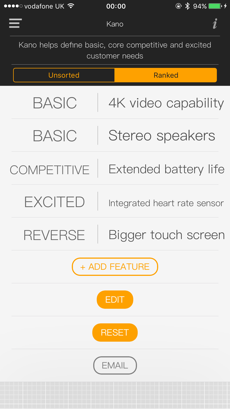
Lean 6 Sigma Calculator $9.99 Category: Analysis | The Lean 6 Sigma Calculator is developed with consultancy advices from an experienced Lean Six Sigma professional who has been deploying the methodology for more than 15 years in the financial services industry, providing strategic quality planning, training and project facilitation to management, black belts and green belts from general banking, insurance and technology operations across 18 countries in Asia Pacific. This application provides a set of 20 commonly used Lean Six Sigma calculations, which are essential to managers, sponsors, champions, black belts, green belts and other professionals throughout the DMAIC improvement cycle. The simple user interface design, graphic displays, and benchmark information of this calculator give you useful data to review the problem, analyze the root cause and define the best fit solution. It also provides you a mean to easily communicate your findings to convince relevant stakeholders in a quantitative rather than a qualitative manner. With this set of calculators downloaded in your iPhone, you will be able to master the application of Lean Six Sigma for competitive continuous improvement at the finger tips. *What’s New In this Version : 2.0 (iOS 3.0+ Tested) Updated* **For any suggestion or comment, please contact the following mail address: ldesign.servicemailbox@gmail.com
|


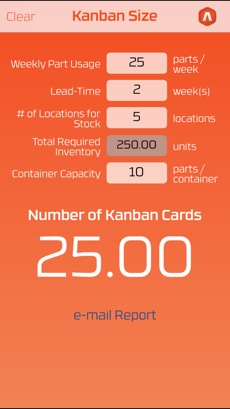
Kanban Size $0.99 Category: Analysis | A kanban calculator used to determine the ideal size for units within the kanban. Great for any software development or manufacturing process.
|


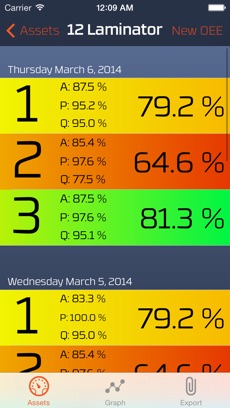
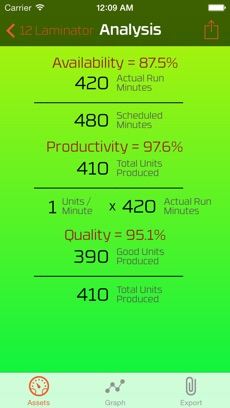
OEE Monitor $0.99 Category: Analysis | OEE Monitor is a universal app for iPod, iPhone, and iPad. Quickly create an OEE calculation, and view through an organized list of Assets and Production Dates. View OEE in an easy to view graph to identify if processes are improving appropriately. With a quick glance, you can compare all production shifts for analysis by production date, including availability, productivity, and quality components of the OEE formula. Email OEE Analysis reports directly from app to your colleagues. Attach OEE data in a .csv file to import with your favorite spreadsheet application like Excel or Numbers! Identify quality or scrap opportunities in your manufacturing processes. Understand production losses through downtime. OEE Monitor allows you to compute OEE and store it for historical comparison. Through providing the following components you will be able to identify opportunities in Availability, Production, and Quality: Scheduled Minutes Perfect for any process, machine, and facility!
|
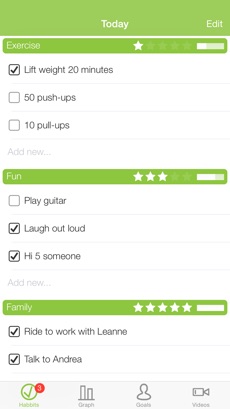
Lean Personal Development (PD) $0.99 Category: Analysis | Lean PD is the most effective way to develop yourself! Lean=efficient or elimination of waste. PD=personal development. So, Lean PD is the efficient way to personally develop yourself to reach your maximum potential. The whole concept is based on the idea of developing daily habits that support your BHAG (Big Hairy Audacious Goal).
|


Want to learn more about Lean and Six Sigma tools, and apply them to an improvement projects? Check out these low-cost online courses and certification programs


Earn a 33% commission for selling our digital products. Learn more
Let us sell your products on our store. Learn more