Can Six Sigma Help The Recycling Problem With China?
You might be hearing a lot about recycling and the changes going on in China over the past year, called the “National Sword” policy.
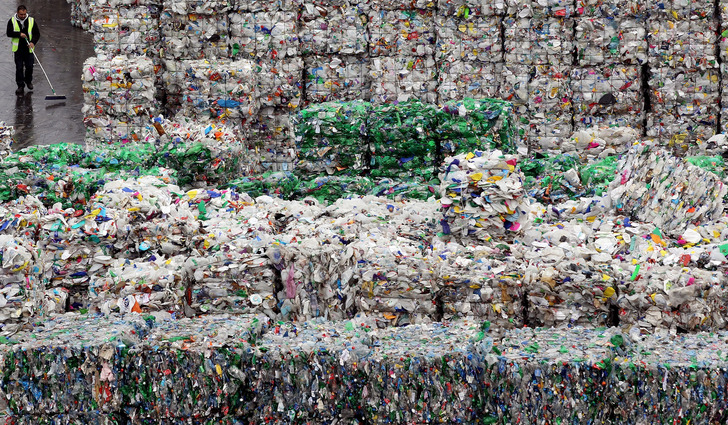
China has really cracked down and rejected recycling shipments from the U.S. since March 2018, stating that the contamination levels are too high.
The requirement was dropped last year to “no more than 0.5% contamination.”
Previous to the new policy, there was an established requirement to achieve no more than 1.5% contamination. But it was the recent enforcement of the contamination level that really changed the situation, not the new target of less than 0.5% contamination. Here’s a great timeline of events from Resource Recycling if you’re interested in learning more.
If the goal is 0.5%, where are we at today?
Rough estimates from a few self-reported recycling facilities have claimed that they can reduce existing contamination levels to between 1% and 2% when additional sorting and inspection is added to their current operations. So that means we are well above 1-2% today.
Sorting and inspecting at a material recovery facility (MRF) is a big improvement from the estimated 12-32% contamination received from residential and business customers upon pickup by waste haulers (average of 25% according to Waste Management in one study, 16% in another study).
But even with the extra processing and cost to get under 2%, it is still not adequate to meet China’s expectations. In fact, one article mentions a contamination rate of 75% for “mixed bales” of low-quality plastics.
To recap, we have a requirement to achieve 0.5% contamination, but very little data to tell us if we are close or way far off. Yikes!
Sounds like a typical problem I’ve seen in my 20+ years of process improvement work (on a much bigger scale of course)! A big problem but not much data to understand what’s going on…
One of the more popular approaches to reducing defects (contamination) and improving the quality of a process like this is called Six Sigma.
Six Sigma is a structured approach to solve problems, and is very effective at reducing defect (contamination) rates. It uses a 5-step process called DMAIC, which stands for Define, Measure, Analyze, Improve and Control.
Each phase requires the use of specific improvement tools to ensure the correct analysis and evaluation before proceeding to the next phase. If you complete all the steps correctly, your chance of improving the problem is much greater!
Six Sigma was developed by Bill Smith at Motorola in the early 1980’s, and some of the core tools have origins back to the early 1900’s. One of the largest deployment of Lean Six Sigma occurred at the US Department of Defense, which reported saving billions of dollars.
Here is a simple Six Sigma project I worked on back in 2012, related to increased recycling at Kinnick Stadium at the University of Iowa, which indirectly helped the contamination rates.
Let’s consider the DMAIC approach to explain the China recycling situation, and how Six Sigma tools can help address this problem through a potential improvement project.
Define Phase (D) – What is the actual problem and who cares?
Before starting any improvement project, the first step is to agree on the problem, and put it into numeric terms.
The current contamination (defect) rate is at least 2% (probably more like 10%), and we need to be below 0.5% in order to meet the needs of the customer (China).
Already, you can see we might have some issues in solving this problem.
If you don’t know how you are doing now with the contamination data, it’s really difficult to figure out how to improve.
It seems the contamination data isn’t readily available when it leaves the U.S., and I haven’t found any data from China on what they claim are the actual contamination levels when they perform their inspections (if you know of some data, please contact me!)
In Six Sigma, you must always look at the problem from the customer perspective.
If you don’t know how your customer perceives the problem, and how they measure the problem, you will struggle to solve the problem.
In other words, there was already a struggle to meet the 1.5% level, and with the additional enforcement and reduced level, we are now getting rejected shipments, which is where we are at today, and why it is now a major problem.
But remember that the problem has apparently always been there, but the enforcement wasn’t there until now. This is important to know when solving a problem. It’s a different approach if we used to be below 0.5%, and then we have been trending upwards lately, versus we have always been unable to meet the requirement.
If you categorize each piece of contamination in a shipment of recycling as a “defect,” then it aligns closely with traditional quality metrics.
In Six Sigma, we can convert the defect rate into a sigma level, which allows you to compare your process against the common goal of 6.0 (thus the term, Six Sigma).
If we convert the current defect rate and requirement from China into a sigma level, we would need to achieve a sigma level of 4.0 (using a Six Sigma calculator). This equates to 5,000 contaminated items per million items shipped of recycling to China. This could also be expressed as weight, so 0.5% of weight contaminated as a percentage of the total recycling weight.
Our current defect rate is unknown, so let’s assume it is 10% for the sake of argument. At 10% defect rate or 10% of the weight, the sigma level would be 2.78.
Luckily, China has not adopted a goal of Six Sigma performance, which would only allow no more than 3.4 incorrect items for every million recycled items shipped! In terms of weight, it would be 0.00034% of the total weight.
Six Sigma would be a very challenging goal to achieve!
The key goal in the Define phase is to clearly define the problem.
A problem is defined as the gap between where you are today and where you want to be. In our example, it would be the minimum defect rate (percentage of unacceptable items) versus the current defect rate. For the recycling problem, the current contamination levels of recycling sent to China is not clear, so again let’s assume it is around 10%.
Therefore, if we are currently at 10% contamination (2.78 sigma), and we need to get to 0.5% (4 sigma), then we have a problem. We are 9.5% above the requirement.
In the Define phase, we also need to explain why this problem is important, or in other words, the business case for why we need to resolve this problem more urgently than other problems we could be working on.
High contamination levels means that valuable recycling is not getting back to the manufacturers for use in new products, and these shipments are being held up in the U.S., creating storage problems for the recyclers, creating confusion in the recycling markets with residents, and increasing the risk that recycling will end up in the landfill. In addition, the recyclers are not getting paid for the recent shipments, which is putting financial strain on their business. The Recycling Partnership seems to think it’s a big problem, and has committed $1 million to help reduce contamination on the West Coast to address this $300 million problem.
If I was working on this project, I would spend considerable time understanding the actual contamination rate as perceived by China before moving to the Measure phase. This data would be used to “slice-and-dice” the data in many ways, to see if I could pick up some interesting patterns or tendencies or success “bright spots” that could help us solve the problem. For the sake of time, let’s assume 10% is correct and we have some information about what is contaminating the shipments.
Finally, we need to decide which stakeholders need to be involved in this project, that can help resolve the problem. Identify a broad mix of people who can view the problem from many different perspectives. For this problem, we would want recycling companies and waste haulers, Chinese inspectors, residents from different parts of the US, MRF representatives, shippers, and various government officials (just to name a few). The SIPOC diagram and Materiality Analysis are good tools for identifying and assessing stakeholders.
Here’s a good video that summarizes the China recycling problem
Measure Phase (M) – What is really going on?
The first step in any process improvement is to try and minimize the impact of the problem on your customer or stakeholders. If we can figure out a way to improve the defect rate through additional activity (inspection and sorting), then the customer (China) will be able to start accepting shipments again. However, this can be very expensive in the short term. It is also very expensive not being paid for shipments, so the amount of containment activity should be evaluated against the lost sales. Even if it costs more to contain the problem, it will be better in the long run, rather than losing the customer completely (which might have already happened due to lack of action over the years).
This additional inspection and sorting activity is the first step to improving the process if done correctly. Data needs to be collected and studied aggressively to understand why it is getting into the recycling system and being contaminated in the first place. So it accomplishes some immediate improvement, and provides good data for solving the underlying issue.
In fact, this isn’t just a temporary solution for some facilities. Community Conservation Center in Berkeley, CA has been able to maintain the 1% or less contamination levels for the past 30 years. One reason is that they deploy many manual sorting processes in their operation.
However, it seems that we don’t have an easy way or strong desire to contain the contamination problem, so instead the US is looking for new customers that allow for higher contamination levels.
Even if we had a lot of data, Six Sigma methods state that we must be able to trust the data. If we have poor data to start, it will make it very difficult to determine what’s going on. There are statistical studies that can be performed that help verify the quality of your data, called Measurement Systems Analysis (MSA).
Here are some examples of additional data collection taken on by cities and municipalities:
- The town of Watsonville, California established a dedicated, full-time auditor to inspect recycling, organics and trash carts before pick-up from residents, in order to better understand the problem, and provide feedback to their customers.
- Albuquerque, New Mexico developed and implemented a system to capture contamination data into a database by location, and inform citizens of problem items in their recycling carts.
Once new data collection is in place, or the existing data is verified to be highly reliable data, then it is suggested to document what items are being found during the inspection and sorting, so the root cause of the contamination can be investigated and reduced in the future.
But before you start adding a bunch of data collection, you should make sure you are taking advantage of the data you already have. Check out this approach from the Resource Recycling article called “Digging Through the Data Points”
In addition to collecting new data, all the process steps need to be observed, understood and documented, so everyone is clear how the processes operate today. We also need to talk directly to the people working in these processes, and “pick their brain” on what’s really going on, and gather suggestions and ideas from their perspective. This is called “going to the gemba” to observe and interact with the people doing the actual work.
The combination of data collection, observations of the process, and feedback from the workers and stakeholders will help the project team develop a clear understanding of the current state.
Once we have data to review, we can prioritize the type of defects, in order to get the most impact with the limited resources and time. The Pareto chart is a great tool to stay focused on the largest contamination source.
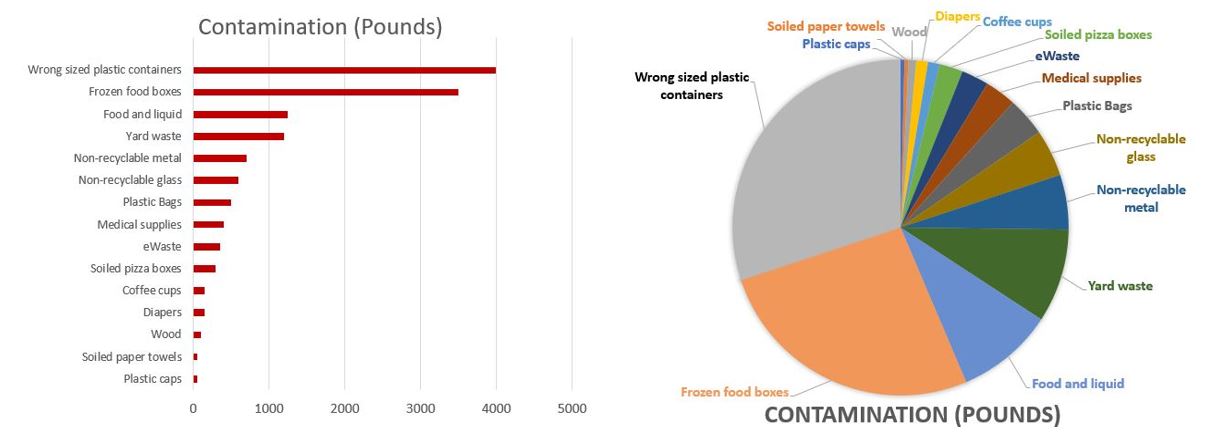
In the example chart above, to make the biggest impact, this data suggests you would focus on the top 2 items: wrong-sized plastic containers and frozen food boxes. For everything else on the list, you should ignore them for now, so you don’t get overwhelmed and distracted.
Often times at the end of the Measure phase, we revisit our problem statement and business case, as it might change with new information. The problem might need to be more accurately worded, might be a bigger gap or issue than we thought, or not as bad as we thought. In my experience, revisiting the problem statement happens often, so don’t assume your first attempt will be the last one.
Once we have an updated problem statement, we fully understand the entire process, and have good data on which contamination to focus our efforts, then we can move to the Analyze phase. We can’t solve all the contamination at once, so we need to stay focused on the top 1-2 sources for this project. Later projects can work on the remaining contaminants.
Analyze Phase (A) – Why is the problem happening?
Based on the Pareto chart data, the team can dig deep into the reasons why there is contamination. For example, if we determine that the largest contamination is from residents that are putting the wrong-sized plastic tub containers in the recycling bins, then we can dig down to the root cause of the problem. We use the 5 Why’s technique (ask “why?” at least 5 times) to get to the heart of the problem, and supplement that with as much data as possible.
Why #1: Why are wrong-sized plastic tub containers being recycled?
Residents don’t remember the size restrictions
Why #2: Why don’t they remember the size restrictions?
Not clear in the handouts what the restrictions are
Why #3: Why is it not clear in the handouts?
Information is mentioned in small print at bottom, not easy to read
Why #4: Why is the size restriction listed in small print?
Graphic design ran out of space on handout and moved it to different area of handout
Why #5: Why did they move it to different area?
Running on a short deadline and couldn’t reach organization for advice outside normal business hours
Why #6a: Why couldn’t they reach after hours?
Not provided contact information to key resources for urgent matters
Solution #1: Include after hours contact information to design teams for urgent matters on all new projects
Why #6b: Why were they on a short deadline?
Technical team provided design requirements to design team much later than planned, but no adjustments made to schedule
Why #7b: Why were no adjustments made to schedule?
Design team was the only one with a financial incentive to achieve deadline, didn’t want to risk losing bonus.
Solution #2: Connect incentives across all departments on future projects to encourage teamwork and better coordination
As you can see, the two identified solutions get into the process breakdowns in the organization. It’s often a much different solution than what people initially think will resolve the problem in the long term. That’s why the 5 Why’s approach is so popular.
There are other actions that need to be done in the short term to fix this issue. Perhaps re-printing of the handouts? Maybe a different communication to residents about the sizes? Maybe some stickers added to bins by the haulers for those that make the most mistakes?
For more complicated problems, there will need to be more data analysis performed to uncover what is going wrong in the process, as teams cannot just answer each why without quite a bit of effort. This is where the tools of Six Sigma really shine. Tools such as designed experiments, regression analysis, and ANOVA can assist with uncovering the root cause(s) or sources of variation.
Once your team has fully evaluated the reasons behind the problem, it’s time to develop and validate an improvement plan.
NOTE: You can see how much time has been spent on this project already, and only now are we ready to talk about solutions. Too often, teams make the mistake of jumping to solutions, and they end up wasting more time on ineffective solutions, just to please their management and show them that they are “doing something.” Six Sigma will force you to slow down in order to ensure that you find effective solutions. This is what your management ultimately wants, but they will pressure you to skip steps and implement solutions way before you are ready. You must fight against this, or you risk not fully addressing the problem or even making it worse and frustrating the team members.
Improve Phase (I) – What can be done to reduce the problem?
In the Improve phase, we need to accomplish two major things:
- Decide what actions to take
- Verify that those actions were effective
Some actions are easy for the team to agree upon. Other times, the team will disagree, and more complicated methods will need to be used, such as prioritization matrices or multi-voting techniques. These approaches provide more analytical evaluation of options, and are superior to “majority rules” voting and decision making.
To verify if actions will work, a pilot project should be conducted, and data collected to see if the solution actually works as intended. You can set these up quickly, and the investment in time and money is often much less, so there is less risk. This concept is also captured in the Lean Startup methodology when defining your Minimum Viable Product (MVP).

Let’s say we want to verify that adding reminder or “Oops” stickers to bins of residents who keep trying to recycle the wrong-sized plastic containers will work. One idea is to identify one section of town, evaluate the residents current data for contamination due to wrong-sized containers and establish a baseline metric. Let’s assume that 12% of residents are including wrong-sized items. Next, we add reminder stickers to the bins of those residents for 2 pickup periods, and then re-gather the contamination data. We compare the before and after results to see if the stickers actually worked.
Finally, the results need to be statistically analyzed, to show that the improvements are not just due to chance or luck, but have statistical evidence supporting them. This is called a hypothesis test, which results in a decision about the statistical validity of a change in your data before and after improvements are made.
If the results after the stickers were added drops from 12% to 3%, most likely it will be statistically valid.

If the results drop from 12% to 10%, it might not be significant, and we could not conclude that the stickers are making a difference (or we don’t have enough data yet). In that case, we would need to select a different solution to test out to see even greater improvements, or continue to gather more data.
If the results are statistically significant, and we are happy with the amount of improvement it will have on our problem, then we develop a roll out plan to implement the reminder stickers across the entire town. We also can estimate the impact we will have across the entire town, if we get similar results as our pilot project.
Control Phase (C) – What metrics need to be monitored to ensure long-term success?
In the Control phase, we need to make sure that the results will last in the long term. Often times, the data will improve initially, but it cannot be maintained after a few months. This is because the process controls have not been implemented.
The first step is to document the improvements, so it’s not based on “word of mouth” and it can be shared with new employees who weren’t involved initially in the project.
Next, there should be some data monitored, so if the process starts to revert back to “old ways” or the excitement wears off from the initial activity, then there are numeric indicators that action should be taken to get the process back “in control”
For our example, we would want to continue to monitor the contamination rate with a proportion (p) control chart, which plots the contamination percentage over time, and helps identify trends, shifts and outliers in the data. You can download an Excel and Google Sheets version of the p-chart.
If the results continue to maintain after a few months, then actual costs savings and benefits should be calculated and shared with the leadership team and stakeholders.
How much time and money is being saved with less contamination in the bins? The calculation of actual results will inspire the team to continue their work, or give them guidance on how to make adjustments or changes.
Finally, the team should share the results of their project with others that could benefit from the project knowledge and lessons learned. This could include those within the key organizations involved, or the wider public, or even those with no stake in the outcome of the project that want to learn about the approach taken.
Conclusion
I hope this article has helped you better understand Six Sigma and the DMAIC model, and how it can help you solve any type of problem, both large and small! If you have questions about this approach, or want to get some advice on your project at work or in your community, please contact me and we’ll setup some time to talk!
Check out some additional resources below you might like…


Want some free DMAIC references and downloads? These templates can be downloaded to help you through your own Six Sigma DMAIC project.
Want to see how Lean and Six Sigma can be applied to reduce wasted food? Check out our FREE workshop series (4 classes)!
Want to learn more about Lean or Six Sigma? Sign up for the FREE Lean Six Sigma and the Environment online course

Single use coffee cups often contaminate recycling bins because they can be confusing. Check out the program I helped develop with the nonprofit, Recycling Advocates, called Bring Your Own Cup (BYOC), focused on single use coffee cup reduction.


