Description
![]() Download all the slides (PDF version, with watermark overlay) >>>
Download all the slides (PDF version, with watermark overlay) >>>
Do you have so many metrics in your area, that it can be overwhelming and time-consuming trying to assess how things are performing each day? QDIP is a tool we recently discovered that has made this task much quicker, so you can get to the real issue, instead of feeling drowned in data overload, and not knowing where to begin!
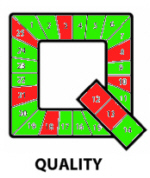
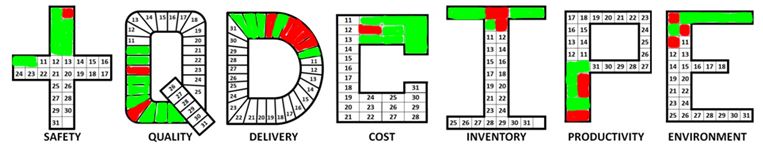
QDIP (SQDC) is a daily process management tool to quickly provide a visual assessment of how a process is operating using multiple criteria: Safety, Quality, Delivery, Inventory, Productivity and Environment. With this tool, anyone can quickly assess the status of a process or cell in a matter of seconds. The diagrams allow you to track up to 31 working days (assume work is done every day of the month). Sheets are 8.5 x 11 inches in size with one criteria per sheet (see image graphic). File format is Microsoft Word (.DOCX). New! Microsoft Excel (.XLSX) version also included in the download (see bottom of page), and Word doc has 52 week option!
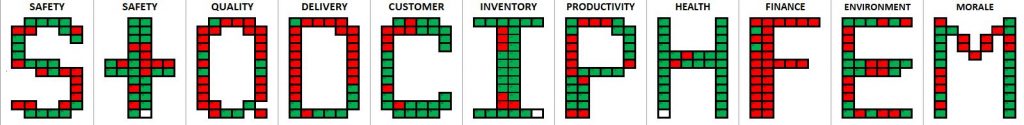
If you use SQDC (Safety, Quality, Delivery, Cost) instead of QDIP, then you can use the plus sign (+) for safety, and we provide the letter C for cost or customer.
We provide the following letters:
- S and + or Safety
- Q for Quality
- D for Delivery
- C for Cost or Customer or Complaints
- I for Inventory
- P for Productivity or Performance or People
- E for Environment
- F for Finance
- M for Morale
- Stopwatch icon for Time
This is our most popular product! We have sold over 100 of these in the last couple years!
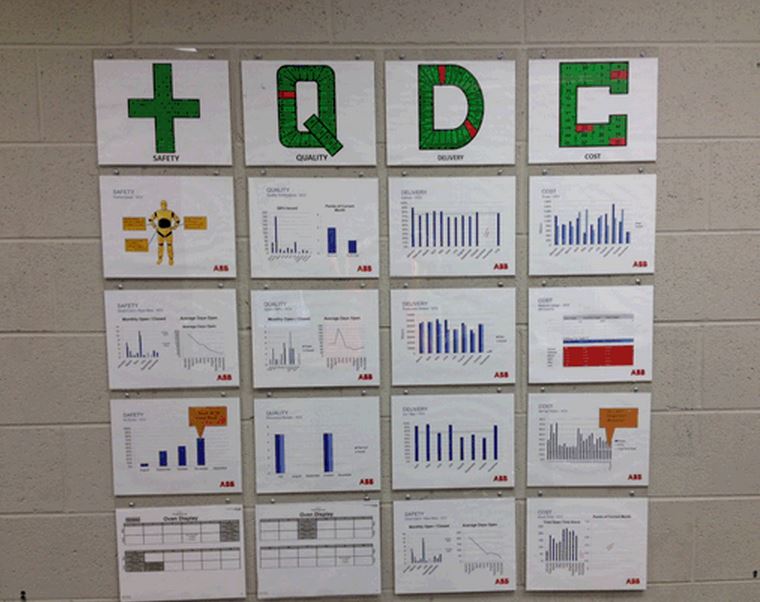
Many manufacturing facilities have a communications board or scorecard near the work area, but the problem is that there are too many charts to look at, and too much information to review. Management needs to be able to quickly look at one sheet per metric, and assess the performance in a matter of seconds, not minutes. These sheets address this gap by providing a simple green and red color coding.

At the end of the month, a manager can quickly assess when the problems occurred, and determine what the emphasis should be in the upcoming month to resolve these issues. If the entire diagram for a given criteria is green, then the key metric should be modified to make it more of a challenge. If the entire diagram is red, then either the metric is too difficult, or there are additional resources or prioritization that is needed to help address those issues.
How do I implement QDIP/SQDC in my area?
Step 1 – Define Key Metrics for each criteria
Example Metrics for each Criteria
| Safety | Quality | Delivery | Customer / Cost | Inventory | Productivity | Environment |
| – No missed days – No injuries | – Less than 5 defects per day – DPMO less than 50 – Test Yield greater than 95% | – 100% on-time to customers, schedule, next process, etc – Complete 10 units per day | – No escape notifications – No defects at installation – No warranty claims in first 3 months | – WIP less than 10 units – No more than 3 pieces at each station – WIP less than $10,000 | – $/hr greater than $150 – Less than 10 minutes of downtime – Team met daily takt time goals | – All equipment shut off at end of shift – No recyclables in trash – 100% Hazardous waste adherence |
Step 2 – Display new QDIP/SQDC diagrams at beginning of each month
![]()
It is recommended that you place them in this order, in a location for everyone (employees and management) to view. You can either laminate each sheet and reuse each month (clean off previous month), or print out a new sheet each month, so you can retain the history
Step 3 – After each production day, color the day on each diagram with GREEN (met goal) or RED (did not meet goal)
After each day, the manager or leader can walk around and look at the most recent day marked on the sheet, to determine whether each metric was achieved. They should only spend time discussing the red items on the sheets, not the green. This should simplify the time spent at each area, and reduce the overall management review time.
Example: After Day 5
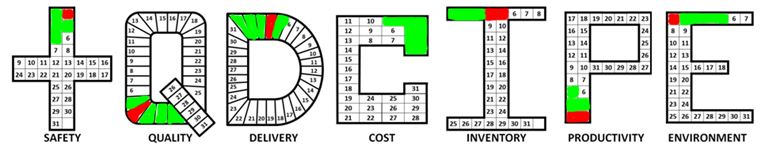
Here are the results from the first 5 days of the month:
– Safety did not meet their metrics on Day 2
– Quality and Delivery did not meet their metrics on Day 4
– Inventory did not meet their metrics on Day 4 and 5
– Productivity did not meet their metrics on Day 1 and 2
– Environment did not meet their metrics on Day 1
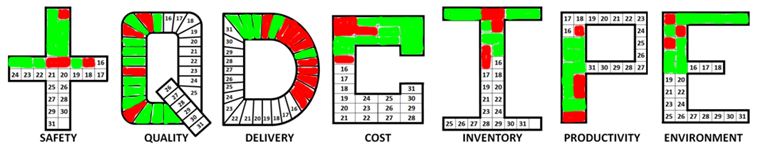
Example: After Day 10
After day 10, Quality has fallen short 2 days, Delivery 5 days, Inventory 3 days, Productivity 4 days, and Environment 3 days. On the 10th day, only Delivery has failed to meet its metrics.
Example: After Day 15
Example: After Day 31

At the end of the month, a manager or leader can quickly assess how often problems occurred, and what the emphasis should be in the upcoming month to resolve these issues. If the entire diagram for a given criteria is green, then the key metric should be modified to make it more of a challenge. If the entire diagram is red, then either the metric is too difficult, or there are additional resources or prioritization that is needed to help address those issues.
NEW! Excel version now included. Simply enter a 1, 0 or -1 into the cell, and it will turn it green, white or red. In 2021, we also added a way to gather monthly metrics for each letter, based on what % of items were marked green.

You will receive two files: Word (.DOCX) and Excel (.XLSX) version
The Excel file is setup for 31 days and now 52 weeks (Productivity, Quality, Customer, Delivery, Safety, and Morale), also known as PQCDSM. In the book The Toyota Way, it’s called QCDSM (Quality, Customer, Delivery, Safety, and Morale). We also include letters for Inventory, Finance, Health, and Environment.
In 2021, we just added a Pivot Table report that will provide a summary of all the greens and red by each letter.

The Word doc has both 31 days (Quality, Delivery, Cost, Inventory, Productivity, Finance, Environment, Health, Morale, Responsiveness, Time) and now 52 weeks (Safety letter S, Quality, Delivery, Cost, People, Morale).
Want to see all the slides? Download a PDF version, with watermark overlay >>>
Want to get more value? Your purchase gets you access to all our Premium templates, as well as online courses and monthly webinars!