Description
Gage Repeatability and Reproducibility (R&R) studies measure the amount of measurement variation that is attributable to each operator (reproducibility) and to the measurement device (repeatability). Gage R&R’s are critical components of any continuous improvement program. However, companies often shy away from them due to the perceived complication, required resource effort or lack of understanding of their benefit.
“The tool is important in understanding variation in our process, but we don’t have the time or people skilled enough to perform them!”
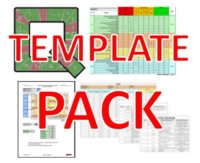
For only $20, you can download this template (see screen shots below) and have immediate results of your study! No statistical knowledge needed. The summarized results make it easy to see where you need to focus your effort on improving the variation!
The template is yours to edit and customize as you choose, or simply use it as is…
No expensive software to purchase, just a simple solution to your needs.
“Thanks for developing an easy to use and understand template, which doesn’t demand a rigorous understanding of ANOVA statistics to interpret.” – K.F.
This template is exactly what you would create on your own, if only you had the time. We have done all the hard work for you, so just follow these simple steps…
- Download the Excel spreadsheet template from our website (did we mention it was only $20)
- Edit the footer with your company logo
- Perform the gage study and enter the appropriate data into the blue boxes
- Review your results and pie chart and then improve your process!!
The template has three worksheets:
- Calculations – This is where you enter the data, and where all the number crunching takes place behind the scenes.
- d2 values – the lookup values needed for the calculation page, based on the number of operators, trials and parts. This template can handle up to 10 different parts, 3 different operators and three trials per part.
- R&R Pie Chart – a pie chart comparing the repeatability, reproducibility and part variation. The image below shows an example of this chart.
Not convinced yet? Let’s run through an example with the template…
Step 1 – Determine the size of your Gage R&R study (you can choose between 2-3 operators, 2-3 trials per part, and between 2-10 parts). A good recommendation is to use 3 operators, 3 trials and 5 parts (45 data points).
Enter this information at the top of the template (shown below)
Step 2 – Add the correct operator name or ID in the blue boxes, along with the collected data into the appropriate section of the template
Step 3 – Enter the specification limits of the parts being used. This will help determine the percent of Gage R&R variation compared to the tolerance width. The template will give you a warning message if your gage variation exceeds 10%, but that can also be customized depending on your company needs.

Step 4 – Review the calculations provided by the template and decide whether your measurement process is adequate for these parts.

Based on these results, this measurement process has an allowable amount of gage variation. Repeatability and Reproducibility are about the same, so a similar amount of variation is coming from the operators as it is from the measurement device.
Want to get more value? Consider the Template Bonus Pack, which includes FMEA Template with Action Priority, QDIP (SQDC) Sheets and Lean Six Sigma Skills Assessment for only $7 extra!