Description
Minitab statistical software is one of the more popular tools for implementing Six Sigma. In this 1-day course, we will walk you through the most popular charts and analysis within the software, and refresh you on Six Sigma concepts. This course is ideal for those looking for a refresher on Six Sigma and Minitab, but is good for those new to the software and concepts. We will show how to generate the reports using both the drop down menus and Minitab Assistant feature.
If you do not have Minitab, you can get a free 30-day trial from their website. We will also show how to run some of the analysis and charts in Minitab Express, a more cost-effective version that can be rented for $60 per year. Either program can be used in this workshop. Use a different software? Let us know so we can potentially schedule a class for that software package.
Please bring a laptop with you with Minitab or Minitab Express installed. Let us know if you don’t have a laptop, and we will help you find one to borrow.
Logistics:
9:00-10:30 AM:
- Intros and Overview
- Minitab overview and graphical analysis
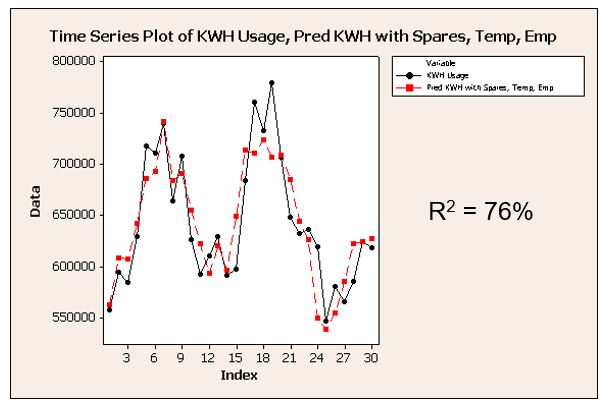
- Individual value plots, box plots, Pareto diagrams, time series plots, scatterplots, histograms, multi-vari charts
10:30-10:45 AM: Break
10:45-12:00
- Summary Statistics
- Statistical process control (p charts, u charts, Individuals charts, Moving Range charts, X-bar and Range charts)
- Normality tests
- Capability Analysis (Cpk and Ppk)
Noon – 1PM: Lunch break
1:00-2:30
- Variable Gage Repeatability and Reproducibility (R&R)
- Attribute Agreement Analysis (Attribute Gage R&R)
- Analysis of Variance (ANOVA)
2:30-2:45: Break
2:45-4:00:
- Hypothesis Tests (2 sample t-tests and 2 Variance F-tests)
- Regression Analysis
- Design of Experiments
We will use an example of a pizza shop throughout the exercise to teach you which tools to apply, in order to help the shop become more profitable and sustainable. However, you are highly encouraged to bring your own data to use in class.
Choose our Friday or Saturday option, depending on your work situation and availability.
Discounts apply to nonprofits, military, University of Portland students/faculty/staff, and those currently unemployed.
If this course is not available…
Self-paced Lean Six Sigma Black Belt Course – includes Minitab training