Our Placekicker Is Out of Control!
The following article I wrote was published in Quality Progress (ASQ) in July 2005. One correction, the use of Pp and Ppk was not common, so my data is calculated using the overall standard deviation, but I used the term Cp and Cpk.
Summary
- Some of the best companies are modeled after the likes of legendary coaches John Wooden and Vince Lombardi.
- Most successful sports organizations perform data collection, root cause analysis and statistical process control.
- Learn how to use these tools to rate two placekickers
After completing my football eligibility at the University of Iowa in 1996 and graduating with a bachelor’s degree in statistics, I bounced around between NFL training camps and arena football leagues during the summer months while completing my master’s degree in quality management. I was a placekicker and punter, and there was not a lot of job security in those positions. Instead of applying root cause analysis when a kicker started missing field goals, most teams applied the standard quick fix: “Get rid of the kicker!”
So I decided to get a real job. After spending a few years helping various product improvement teams work through their business problems, I began to see how these same problems existed in my day-to-day life—especially in my kicking and punting, which I had spent nearly 20 years trying to continuously improve.
Being a good quality practitioner, I collected data to better understand where I was and where I needed to be in my place-kicking. It was a perfect example: The goalposts represented engineering limits, and the location of the kicks when they crossed through the uprights represented the process performance. Maybe someday more points will be awarded for being closer to the target, but for now, anything that passes between the uprights is acceptable and worth three points, and anything outside or under the uprights is unacceptable and considered a defect.
Not As Accurate As You Might Think
I wanted to know if my kicking process was stable, if I had good capability and what Cp/Cpk was acceptable for place-kicking. Here’s how Cp and Cpk relate to placekicking:
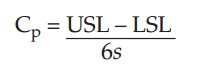
- The process potential index or Cp measures a process’s (kicker’s) potential capability, which is defined as the allowable spread (goal post distance) divided by the actual spread (variation in kicks). The allowable spread is the difference between the USL (upper specification limit) and the LSL (lower specification limit). And the actual spread is determined by the process data (kick results) collected in the study and is calculated by multiplying six times the standard deviation, s, of the process (kick results)
- The process capability index or Cpk measures a process’s (kicker’s) ability to create results (kicks) within given specification limits (goal posts). Cpk represents the difference between the actual
- process average and the closest specification limit divided by the standard
- deviation, s, times three. The higher the
- Cp or Cpk, the better the process for falling within the specification limits.

In most business processes striving for Six Sigma performance, the minimum goal is a process with less than 63 defects per million opportunities (Cpk = 1.33, centered, with no shift). In football place-kicking, a missed field goal would be considered a defect. Obviously, 63 misses out of 1 million is a bit unrealistic, as even the best NFL kickers make only about 90% of their kicks.
Based on the typical statistics for a high school or college kicker, 90 to 95% success on field goals in a practice setting is usually pretty good. This is
closer to a Cpk between 0.5 and 0.7, which is far less than the minimum goal of 1.33. When you factor in the variables that can occur in a game situation, such as weather, snap location, held ball angle, fan noise, nerves, ball variation, ball placement variation, distance and angle from target, a kicker’s percentage can drop to between 70 and 80%, which computes to a Cpk of about 0.25. This is average for college kickers (see Figure 1).

The percentage for NFL kickers, however, is usually between 80 and 90% (see Figure 2) and computes to a Cpk between 0.3 and 0.6. If you are familiar with Cpk values, you know these numbers are poor. But they’re not as bad as the Cpk’s for other sports, such as shooting percentages in basketball, hits per at bat in baseball or, even worse, goals per shots on goal in hockey. Obviously, Six Sigma is not a reasonable goal for game outputs in most sports, but the concepts used to continuously improve toward that level of performance are the still same.

My Personal Results
To calculate Cpk, I needed to plot the location of my kicks within the uprights as they crossed over the bar. To make it easier, I arbitrarily divided my data sheet into six sections, with three on each side of the target (see Figure 3).

My recorded value was an approximation of the section’s distance from
the target. For example, my limits were set at -3 and +3, and the target was set at 0. If my kick crossed at the first section on the right of the target, I recorded +1.0 as my result. If it crossed within the second section on the left of the target, I recorded a -1.5.
Obviously, the results were subjective, and the measurement variation was high, so I personally recorded the location of all my kicks to reduce the impact of these variables (see Figures 4 and 5).
As you can see, my kicking process is stable (see Figure 4), but I don’t have a perfectly normal distribution (see Figure 5).
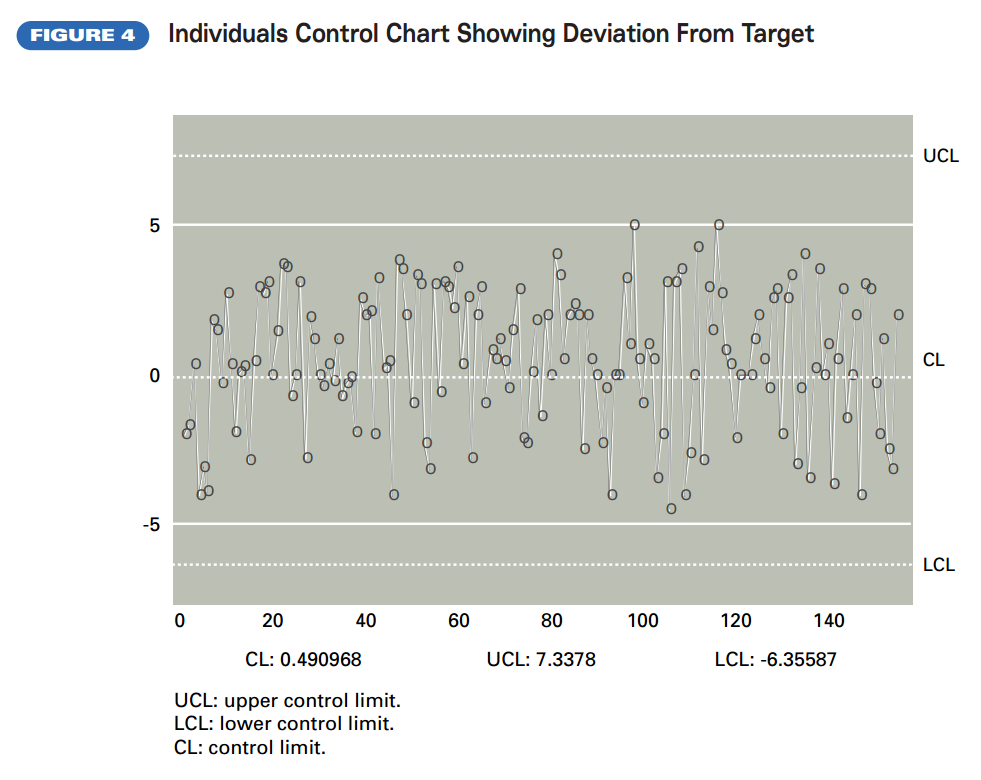

I need to take a closer look at some outliers and consider the fact my average kick location is off target. I need to make a process change to align my kicks closer to target, and I definitely need to further investigate the high peak near the right upright. Clearly, this information could be very valuable to a kicker and his coach.
How To Compare Kickers
My next question was, “How do I compare to other kickers on my team?” This is a question every coach must deal with when more than one
kicker is competing for the job.
In the past, the only way to compare kickers was to look at their percentage of success (yield). If they had the same opportunities for success at similar distances, angles and situations, then that’s the percentage that was used to make a decision. Unfortunately, too much information is lost when attribute
(pass/fail) data are used instead of variable or measurement data.
By collecting detailed information about each kick, I will show how coaches can make better personnel decisions (who should be the starter) and get a clearer understanding of the changes needed to improve an individual’s
performance.
I decided to use a couple of local high school kickers, John and Tom, to perform my simple comparison test. I originally planned to have
them both kick the same kicks on the same field on the same day.
Unfortunately, I was forced to record their results on separate days, but I did keep the distance and angles of the kicks relatively the same.
Did that introduce some additional variables into the experiment? Sure, but due to the nature of the position, it was important to include the location and distance variables to give a pure picture of the kickers’ abilities and
best represent the range of abilities needed in a real game. The target location on any kick attempt was the same—centered between the
uprights—so I don’t believe the variables were a major concern. If I held everything constant, I might have established an unrealistic prediction of their abilities in a game situation.
Who’s the Better Kicker?
I decided to have John and Tom attempt 30 kicks each to give me enough data for a good comparison test, and I used the previous scoring system to record the results (see Table 1).
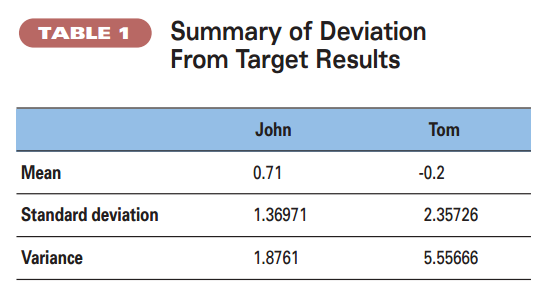
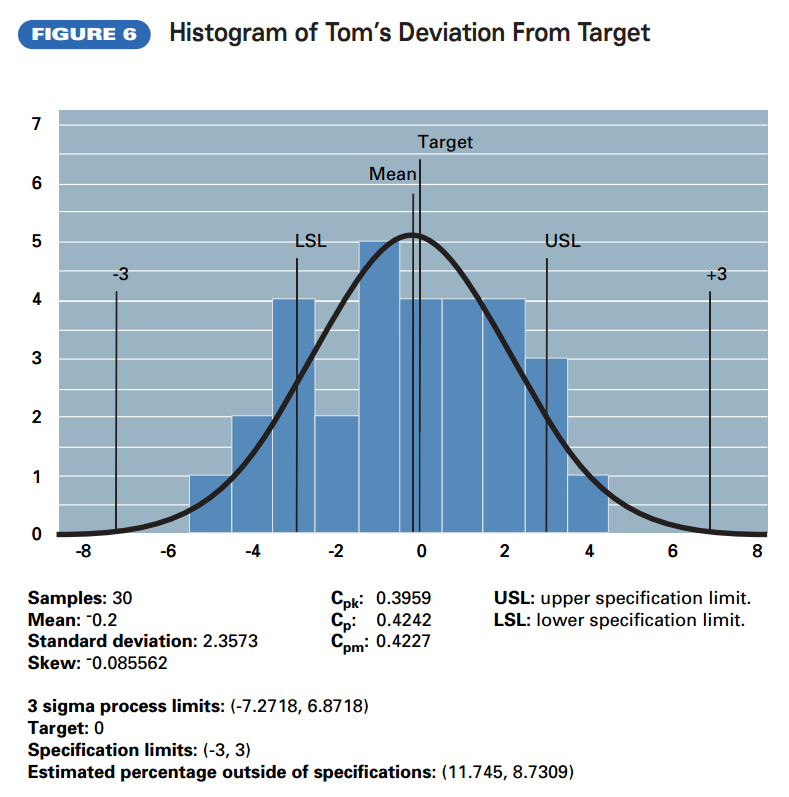
Based on a visual comparison of the two, it was difficult to tell who performed better (see Figures 6 and 7). Tom was closer to target
(mean = -0.2, where 0.0 is ideal), but had more variability (s = 2.36). John had a larger deviation from target (mean = 0.71), but less variation (s = 1.37). I also looked at the Cp and Cpk values to determine who was better. Tom had a Cp of 0.424 and a Cpk of 0.396, while John had a Cp of 0.730
and a Cpk of 0.557. Based on the standard deviation and Cp/Cpk calculations, I determined John was the better kicker.

As with most business processes, reducing variation is key. The same is true for place-kicking. The less variation, the more consistent the placekicker. It is much easier to realign a placekicker to a new target line than it is to reduce variability in his steps, approach speed, approach angle, foot placement and leg swing. I then performed an F-test against John and Tom’s variances to see if that difference was significant (see
Table 2). An f-test compares the variances (squared standard deviations) of each kicker to see if the ratio (John’s variance/Tom’s variance) is significantly different from 1.0 (the ratio if both variances are
equal).
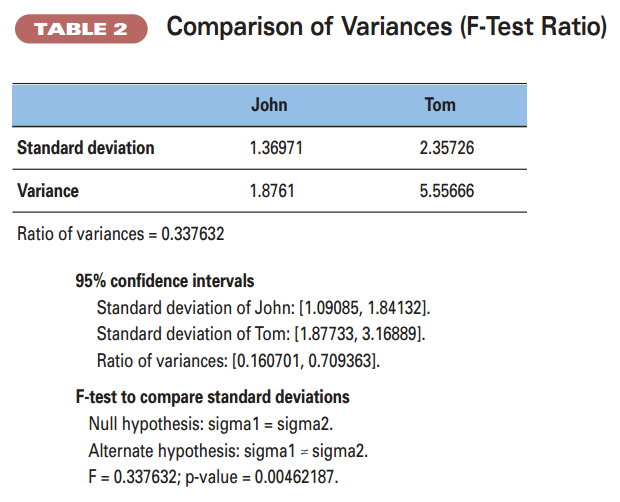
The results showed a significant difference between the variances
of the two kickers (a p-value of 0.0046 is less than 0.05). I would recommend their coach choose John as the kicker because his variation was smaller, but John should work to realign his kicks more to the left, which would bring them much closer to target.
Tom should keep the same alignment to his target, but he should work on reducing special causes in his kicking process through practice and concentration.
Other Uses
I made my recommendation after looking at the results after one day, but what if Tom was more consistent day-to-day, or John had a great performance the day of the competition, but his performance was erratic after that?
I might have ended up making a decision that would not be ideal in the long run. To prevent this problem and monitor the kickers’ performance over time, I could input the data on a control chart.
In this case, John’s control chart would show a trend or shift in his performance, and Tom’s would show stable results over time.
But what if John was made starting kicker at the beginning of the season, and midway through he started to pick up bad habits, forcing kicking out of control? A control chart would likely see the trend, and the coach could make a position change before John missed a kick in a game. The coach
would be able to use data instead of instinct and gut feelings to support a position change and prevent a poor performance from happening in a game.
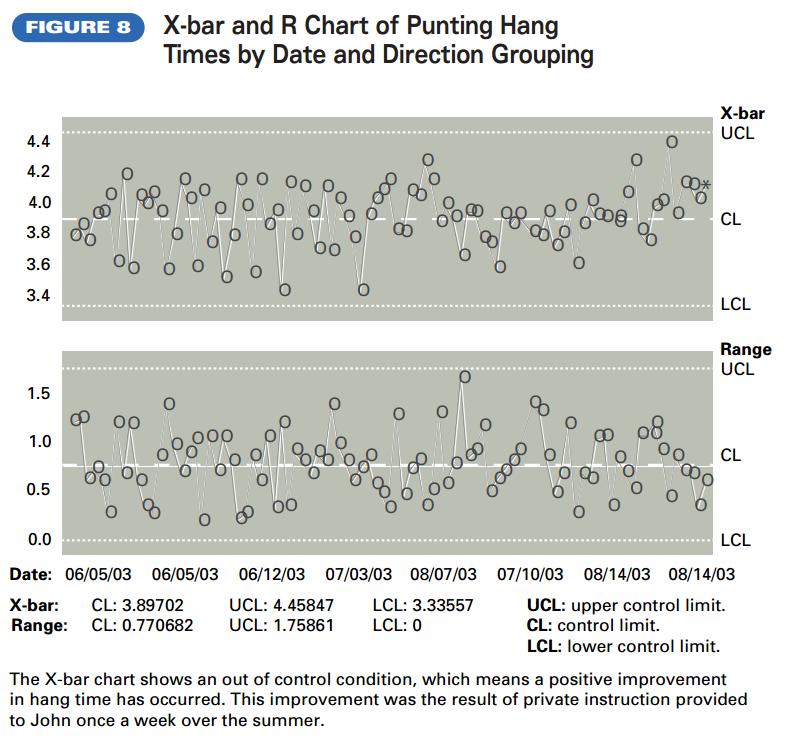
Similar analysis can be performed on a punter’s hang time (time between when the ball leaves the foot and when it hits the ground or is caught) and punt distance (yards landed from the line of scrimmage). When a control chart for hang time in seconds goes out of control on the high side, the
coaching staff can state a significant improvement (see Figure 8).
Coaches can also create Pareto charts for defect types, such as mishandled snap, poor snap, inside drop or outside drop. The possibilities for using statistical process control and basic quality improvement tools in these applications are endless.
As future athletes become bigger, faster and stronger, a greater emphasis will be placed on using statistical techniques to better understand how sports athletes perform and provide teams with the extra edge they are always looking for.
Table 3 shows how other sports could easily apply these types of analyses, even at the youth level.

Written by Brion Hurley

