Cost savings from process improvements can be misleading
I’ve been to many conferences, and have seen lots of companies claim cost savings and metric improvements that are very impressive. However, the more experienced I get, the more skeptical I get of these claims.
First off, let’s define what process improvement savings should be. It should be the elimination of waste in a process (removing non-value added work), improving quality to the internal and external customers, reducing the time to complete value added tasks, or redesigning a process to provide more value to a customer.
Savings should not be the outsourcing of processes to another country to save money, or cutting heads and expecting them to “be lean” in order to make up the gap in resources. These are usually short-sighted decisions that end up costing the company more money in the long run, and risk negatively impacting the customer. But for this discussion, we will focus on one more incorrect savings: when the bottom line benefits do not actually exist.
Let’s talk about one scenario that I’ve seen. Short term savings.
Let’s say the process is tracking the Work in process (WIP) for approving charge numbers, so employees can start work on a new program or project.
Refer to the table below
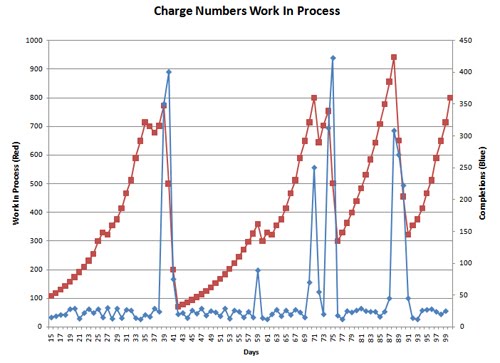
Starting at Day 15, the number of charge numbers waiting for approval is 108 (red line). Each day, that total grows larger, as the amount of time available to complete these approvals is not sufficient to keep up with the new requests. This means the process will never be able to cut into the existing WIP. At some point, shown at Day 40, the management gets too many complaints about charge numbers not being available, and they work overtime, and add more resources to complete a bunch of them over the next couple days. They complete 350, 400 and 75 over the three days (blue line), compared to a typical day of around 20-30.
If we were to capture the savings from bringing the total number of charge number requests from 772 to 71 by Day 42, you could conclude a huge reduction of 90%, or 601 requests. If we determine that each request is $1000 per day in lost productivity, then on Day 39, we have around $772,000 tied up in the process, and it is reducted to $71,000. A savings of $601,000!
However, we didn’t do anything “lean” since we spent additional money on labor to get the number down. We haven’t actually addressed the time available or cycle time per request. Of course, the extra labor should be subtracted out of the savings, so we’ll take out $10,000 for the extra labor/resources.
Next, we assume that this is actual bottom-line savings. In order to claim this as savings or growth, we would have to assume that all employees are not using any other charge numbers, and are charging to an overhead number, and therefore the company is losing money by employing them without work to do. This is highly unlikely. Let’s be conservative and assume that 10% of the employees would be in that situation, so we’ll claim around $60,000 in additional sales/work, not $600,000.
The next assumption is that the 772 open requests would have stayed at that level for an extended period of time. It does appear that this number was continuing to climb, so the number of new requests would have to be reviewed, to see if that was true assumption for the future. If the requests drop off, then they might have been able to catch up on their own.
Finally, we must assume that they can maintain the savings at the low level of around 70 requests for an extended period of time. If we look at the data in the future, you can see that the requests climb back up again. Again, this shouldn’t be a surprise, since we didn’t do anything to address the original problem, that we cannot keep up with the request demand for charge numbers.
Let’s assume that they actually “lean” out the process and are able to keep up with the demand now. One final problem with cost savings is the impact of the improvements to the bottom-line financials of the company. For example, if the process was able to keep up with demand, and a resource was able to be freed up to do some other work, then if that resource isn’t actually given value-added work, the savings won’t actually show up in the bottom-line. You should be able to see an increase in output or work as a result of the freeing up of the resource, which is where the true savings hit the financials. This step is critical, and should be verified after any claimed improvement.
So next time you see some cost savings presented, think about these key points:
1) Did the baseline data represent the true situation if no action was taken, or was it an unusual time period and not representative of the typical situation for that process?
2) Was waste taken out of the process to improve it, or were more resources and cost thrown at it?
3) Were the improvements maintained over a long period of time (6-12 months)?
4) Did the savings actually flow down to the bottom line?
So be careful what you read about lean or six sigma cost savings, and be diligent if you are involved in a project or event to report the correct and most accurate numbers you can.


